Data Market Intelligence
I used six SQL queries on a public 2023 job-postings dataset to examine listed pay, skills, employer activity, and how posting volume changed through the year.
I started with six questions about the data job market and wrote a SQL query for each one.
I looked at listed salaries, skills that appeared across different data roles, less-common skills with higher average salaries, employer posting volume, and changes in monthly posting activity.
The interesting part came when I started checking what each query actually measured. A few results looked straightforward at first, but the filters and denominators changed how confidently I could describe them.
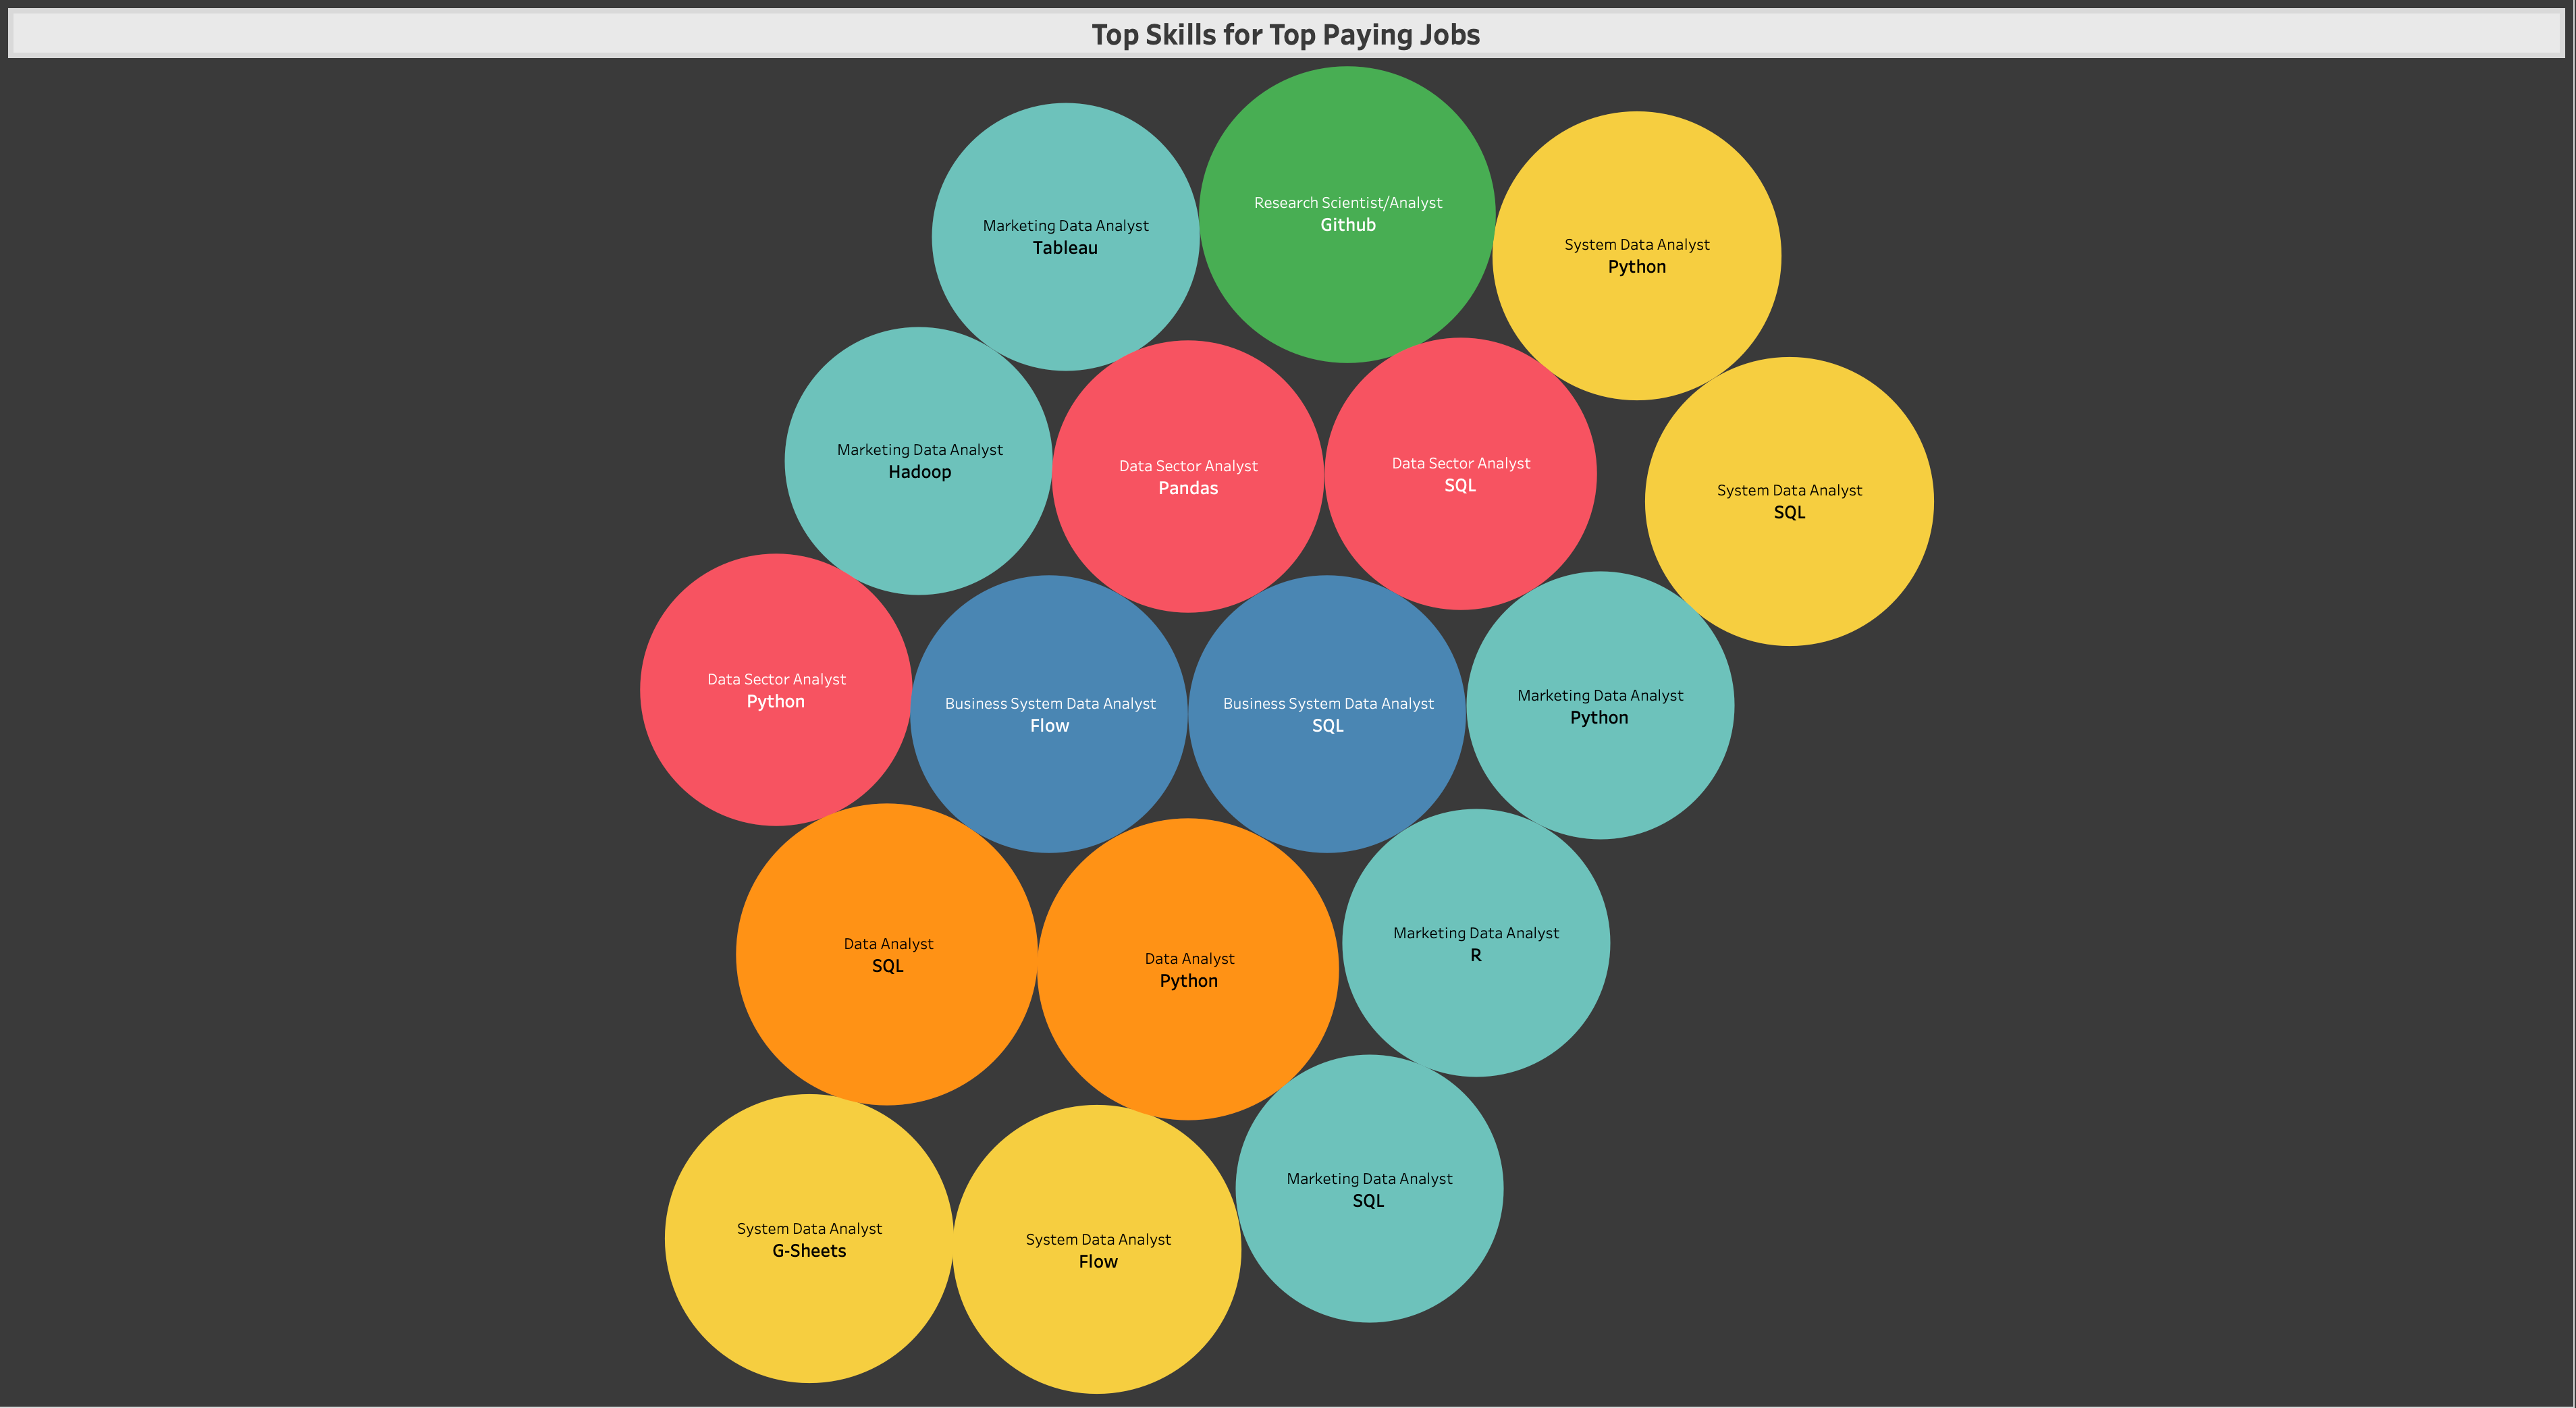
One of the six Tableau views built from the query outputs. It shows skills associated with the top-returned salary listings.
What I wanted to learn
I grouped the analysis around four areas:
- listed pay across the returned roles;
- skills that appeared across analyst, scientist, and engineer roles;
- less-common skills with higher average salaries in the query results;
- posting activity by month and employer.
Six SQL queries covered those questions, and I later used the outputs to build six Tableau views.
What the queries showed
Pay came with an immediate filter lesson
The top-ten returned salary listings ranged from $232,423 to $375,000.
The highest result was a Sr Data Analyst role. My filter excluded titles containing Senior, but it did not exclude Sr, so that row remained in the result.
I kept the row and documented the limitation. The query returned the result correctly based on the filter I wrote; the broader lesson was that the label I put on the result had to be just as precise as the SQL behind it.
Some less-common skills had higher mean salaries
In the query's under-5%-of-postings screen, three skills had mean standardized yearly salaries above the $81,312 benchmark:
- PyTorch: $127,148
- Kafka: $118,639
- TensorFlow: $116,869
Those results gave me a useful comparison between posting prevalence and salary.
The query shows how often those skills appeared in this posting set and the mean salary associated with them. Applicant supply and competition were outside what this dataset measured.
Posting volume changed across the year
January had 6,672 postings and December had 2,856, about a 2.3× difference.
That gave me a clear view of how posting activity varied inside the 2023 dataset.
I treated it as a pattern in this dataset rather than turning one year of posting counts into a general rule about when companies hire.
SQL and Python appeared across all three role groups
Query 6 compared skills across Data Analyst, Data Scientist, and Data Engineer roles.
SQL appeared in 8,289 associated postings.
Python appeared in 7,708.
That stood out because both tools appeared across all three role categories.
The narrower skills were useful to compare on salary and prevalence, while SQL and Python showed up across a much broader part of the dataset.
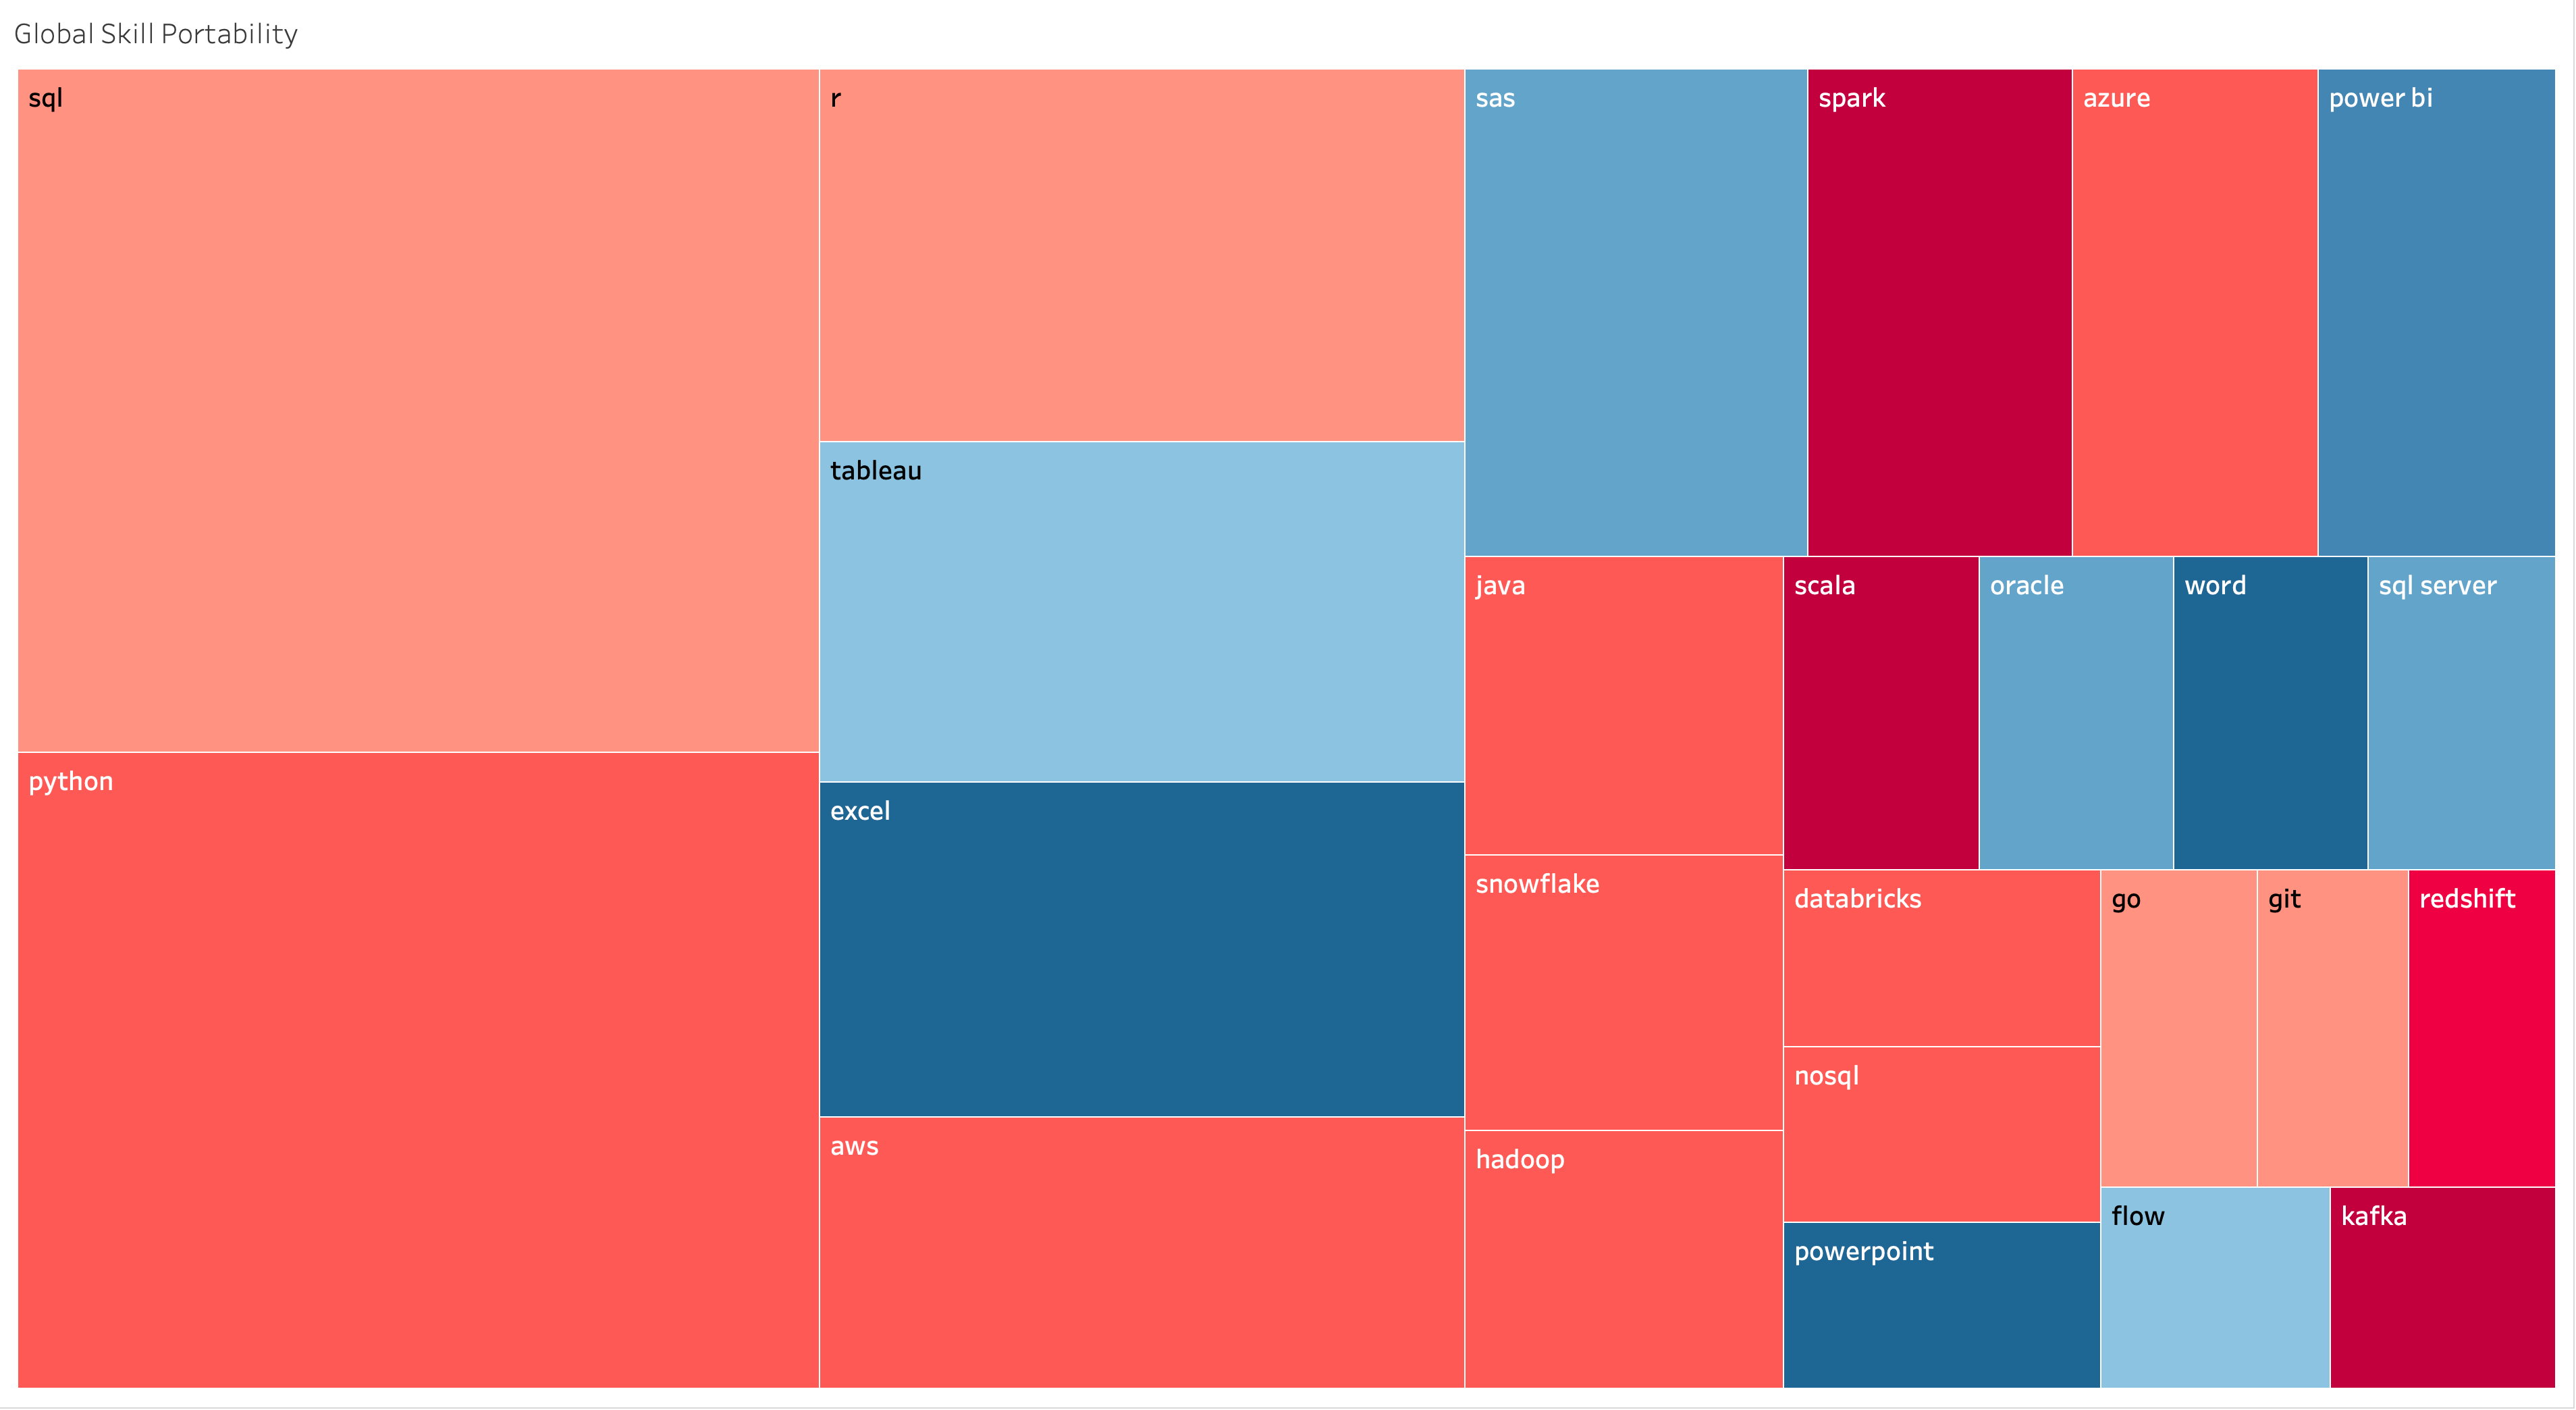
Query 6's cross-role view. SQL and Python are the two largest tiles by a wide margin.
How I built it
I loaded the dataset into PostgreSQL across four related tables:
job_postings_factskills_dimcompany_dimskills_job_dim
I indexed the join keys and wrote six analytical queries using joins, CTEs, percentile calculations, and date extraction.
The queries covered salary listings, skill associations, less-common skills, monthly posting activity, employer volume, and cross-role skill patterns.
I exported the results and built six Tableau views to compare the outputs visually.
The GitHub repository contains the database setup and query logic for anyone who wants the technical detail.
What I learned
The project changed how I think about the relationship between a query and the claim that comes after it.
The seniority filter showed me how one missed abbreviation could change the way a salary result should be described.
The skill analysis made the denominator more important. A skill appearing in a small share of postings says something about posting prevalence, but nothing by itself about applicant competition.
The monthly analysis made the same distinction clear in another way. Posting counts describe posting activity; they do not tell me how many people were hired.
By the end of the project, I was paying more attention to the boundary between what the query returned and what the evidence actually supported.